MCP in Practice: Connecting Claude to Jira, Excel, and Building Multi-Agent Workflows in Minutes
TL;DR
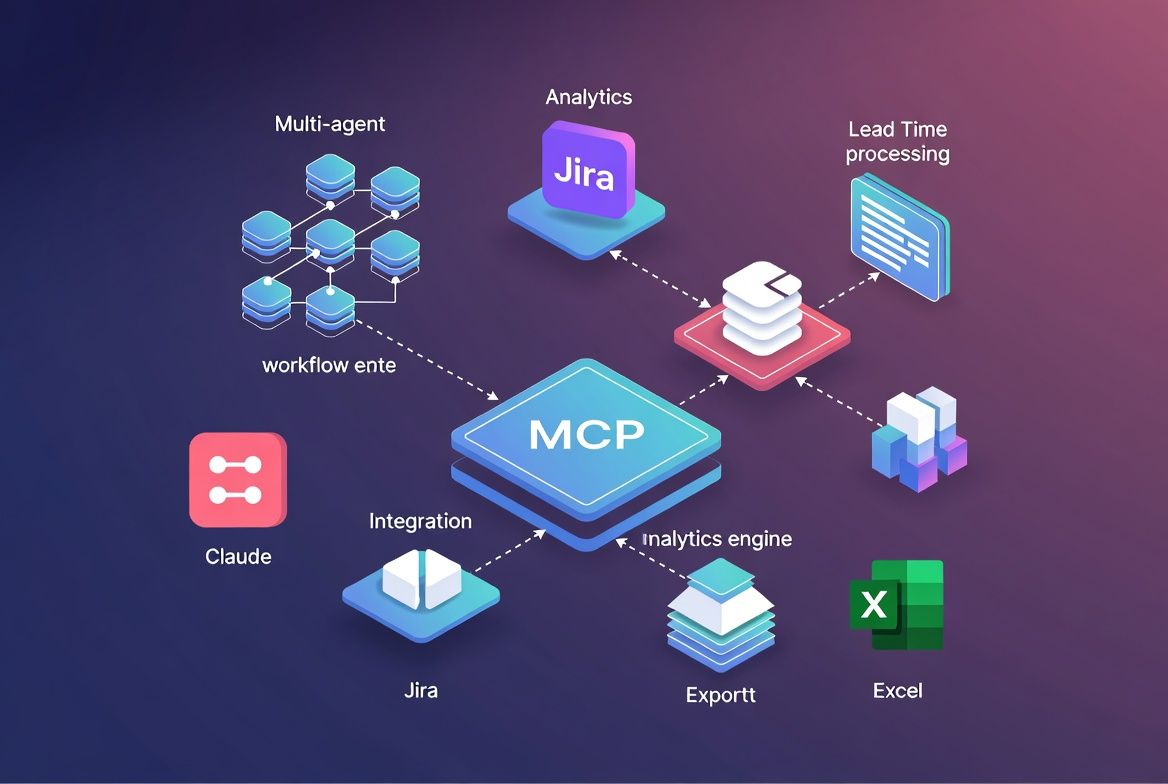
Model Context Protocol (MCP) is the open standard that turns Claude from a text generator into an orchestration layer for your existing tools. I connected Claude to Jira via MCP in under 10 minutes, built a multi-agent workflow that extracts Lead Time, Cycle Time, and sprint velocity, then exports clean reports to Excel — no custom integration code required. This is how it works and where it falls apart.
What MCP actually is (and is not)
Most teams hear “protocol” and assume heavy infrastructure. MCP is closer to a USB-C port for AI. It defines a standardized JSON-RPC interface between an LLM host (Claude Desktop, an IDE, your own app) and external tool servers. Each MCP server exposes tools, resources, and prompts that the model can invoke at runtime.
The thing that clicked for me: you don’t write glue code between Claude and Jira. You run an MCP server that speaks Jira’s API, and Claude discovers its capabilities on its own.
| Concept | Traditional integration | MCP approach |
|---|---|---|
| Setup time | Hours to days (OAuth, SDK, mapping) | Minutes (config + server binary) |
| Maintenance | Custom code per tool update | Server maintainer handles it |
| Composability | Point-to-point, brittle | Plug N servers into one host |
| Discovery | Hardcoded tool definitions | Dynamic capability negotiation |
Having built a few production systems with this, composability is the row I keep coming back to. You connect Jira today, add Confluence tomorrow, and the model reasons across both without you changing a line of orchestration logic.
Connecting Claude to Jira: the 10-minute setup
The Atlassian MCP server (or community alternatives like mcp-server-atlassian) exposes Jira’s REST API as MCP tools. Configuration lives in a single JSON block inside your Claude Desktop config:
{
  "mcpServers": {
    "jira": {
      "command": "npx",
      "args": ["-y", "@anthropic/mcp-server-atlassian"],
      "env": {
        "JIRA_BASE_URL": "https://yourteam.atlassian.net",
        "JIRA_API_TOKEN": "<token>",
        "JIRA_USER_EMAIL": "you@company.com"
      }
    }
  }
}
Once connected, Claude sees tools like jira_search_issues, jira_get_sprint, and jira_get_issue_changelog. No SDK. No webhook. That’s it.
Building the analytics workflow: lead time and sprint velocity
Most teams get Jira analytics wrong the same way: they try to build dashboards. What they actually need is an agent that can answer ad hoc questions against live data.
I prompted Claude with a multi-step workflow broken into three agent phases:
- Data collector — query all issues completed in the last 3 sprints using JQL via the MCP Jira tool, then pull status change history from each issue’s changelog.
- Analyst — calculate Lead Time (created to done), Cycle Time (in-progress to done), and per-sprint velocity (story points completed).
- Reporter — format results into a markdown table and generate a CSV export compatible with Excel.
Worth clarifying: this isn’t three separate programs talking to each other. Claude handles it natively with tool-use chains. Each “agent” is a phase in a single conversation where Claude calls MCP tools, processes the results, then moves on.
Sample output
| Sprint | Velocity (SP) | Avg lead time | Avg cycle time | Completion rate |
|---|---|---|---|---|
| Sprint 22 | 34 | 11.2 days | 4.8 days | 85% |
| Sprint 23 | 41 | 9.6 days | 3.9 days | 92% |
| Sprint 24 | 38 | 10.1 days | 4.2 days | 88% |
Claude computed these by iterating through changelog entries, extracting timestamps for each status transition, and aggregating per sprint. The whole pipeline ran in a single conversation. No orchestration framework, no scheduled jobs.
Adding Excel export via MCP
For Excel output, I added a filesystem MCP server alongside Jira:
{
  "mcpServers": {
    "jira": { "..." : "..." },
    "filesystem": {
      "command": "npx",
      "args": ["-y", "@anthropic/mcp-server-filesystem", "/home/user/reports"]
    }
  }
}
Claude generates CSV content from the computed metrics and writes it to /home/user/reports/sprint-analytics.csv via the filesystem tool. Open it in Excel and you have a pivot-ready dataset. For .xlsx formatting, a dedicated Excel MCP server can handle styling, formulas, and multi-sheet workbooks.
Where this breaks down
I want to be honest about what doesn’t work well:
| Limitation | Impact | Workaround |
|---|---|---|
| Jira API rate limits | Large backlog scans throttle at ~100 req/min | Batch JQL queries, reduce changelog pulls |
| Context window saturation | 500+ issues with full changelogs exceed token limits | Paginate, summarize per batch |
| No persistent state | Each conversation starts fresh | Export results, use MCP resources for caching |
| Auth token management | Tokens in config file are a security concern | Use environment variable injection, rotate tokens |
I wouldn’t run this as a real-time dashboard replacement. It works best as an on-demand analytics tool for sprint retros, executive updates, and process audits — the kind of questions Jira’s built-in reports can’t answer because they require reasoning across issue histories.
What I’d actually recommend
Start with one MCP server. Connect Jira (or whatever tool your team lives in) and validate that the tool-calling loop works before adding anything else. Most of the value comes from that first connection.
Break your prompts into phases: collect, analyze, export. This makes debugging straightforward. When something goes wrong (and it will), you can isolate which phase failed without untangling a monolithic prompt.
Finally, treat this like real infrastructure. Rotate API tokens, restrict filesystem server paths to specific directories, and audit which tools your MCP servers expose. MCP is production-capable, but only if you take security and rate limits seriously from day one. I learned this the hard way after leaving a permissive filesystem path open during testing.